

Visualizing a Bi-Objective Repair-Shop Schedule
An early Gantt-style output from my repair-shop scheduling work, with the model objectives, constraints, solution methods, and source code behind the image.

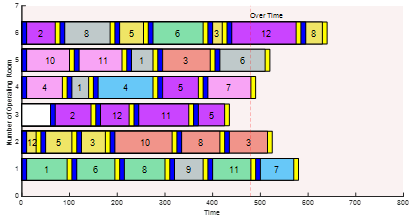
This image is an early schedule visualization from my repair-shop optimization work. Each horizontal row represents a constrained resource, each numbered block is a scheduled operation, and the horizontal position shows its start and finish time. The chart is useful because it turns solver output into a sequence that an operator can inspect.
The optimization problem
The model is bi-objective. One objective reduces total flow time so jobs move through the system faster. The other reduces idle-resource and overtime cost. These objectives can conflict: compressing a schedule may improve completion time while creating expensive resource peaks, and a cheaper resource plan may delay jobs.
The constraints enforce feasible operation order, resource assignment, processing duration, and non-overlap. A valid solution must place every required operation on an eligible resource without allowing two operations to use the same capacity at the same time.
From mathematical model to comparable schedules
I implemented exact mixed-integer programming models and a modified NSGA-II search so I could compare solver-based and metaheuristic solutions. The multi-objective output is a set of non-dominated schedules rather than one unexplained answer. A decision maker can compare flow time with idle and overtime cost, then inspect the selected schedule in a chart like the one above.
Validation on real operational data produced about a 42 percent reduction in total flow time and a 47 percent reduction in idle and overtime costs relative to the comparison case reported in the study. Those figures belong to that dataset and experimental design. They are not universal performance claims.
Reuse the technical work
The public repository contains the official research code, including MATLAB, GAMS, OR-Tools, and FastAPI-related implementations. If you adapt it, replace the operation times, eligible resources, precedence rules, capacity assumptions, and objective weights with your own system data. Then validate feasibility and objective units before comparing algorithms.